Monitoring Activity from the Dashboard
Learn how to monitor recent test activity and view high-level QA analytics from the Rainforest dashboard.
Overview
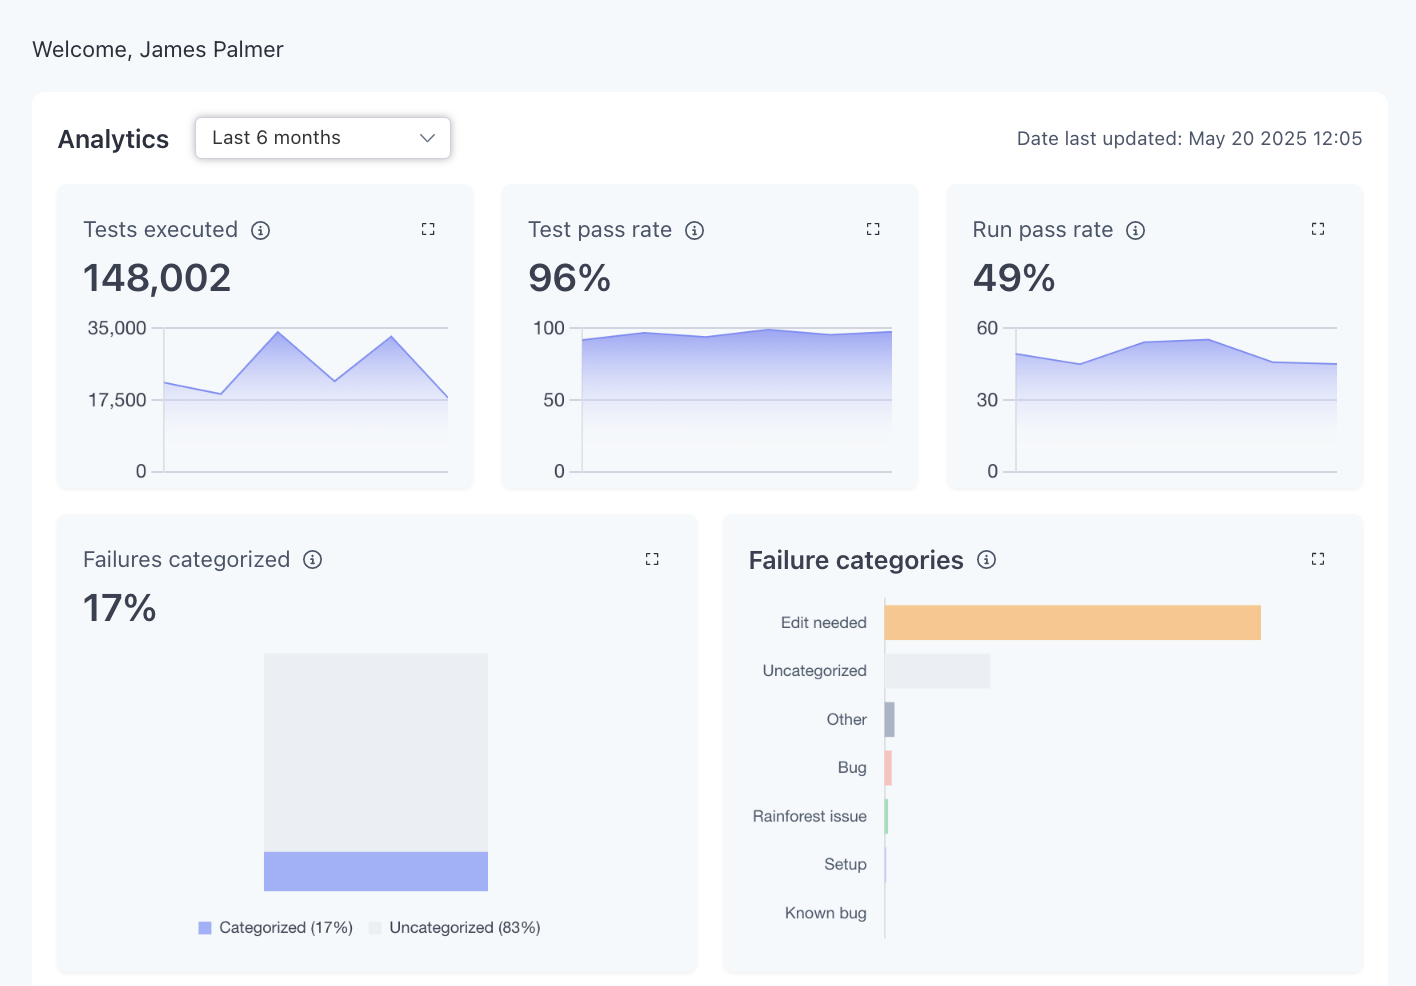
When you log into Rainforest, you land on the Home page. Here you’ll see analytics and a preview of the Activity Log.
How it works:
-
Analytics:
- Filter by time period: Choose a time period to see data for that specific time range.
- Zoom in on specific charts: Select the expand icon on the top right of each chart to expand the view so you can see a more detailed view of the chart. Hover over the chart to see data for a specific group or time period.
-
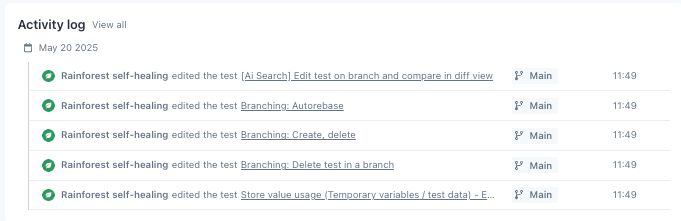
Activity: Use the Activity section to preview the five most recent events in your account. Select View All to jump to the full Activity Log.
FAQs:
- Can I filter by a custom date range (e.g., Jan 15, 2025 - Feb 24, 2025)?
- Not yet, but this is coming soon.
- Can I filter on specific segments of my test suite?
- No, unfortunately, you can’t. If this is something that you’d find particularly valuable, please share the details on how you’d use these features with [email protected].
- Can I create my own charts?
- No, unfortunately, you cannot. If there are specific data points that you’d like to see, please share the details on how you’d use these features with [email protected].
Updated 5 months ago
Did this page help you?