How to Debug Automation Results
Learn how to troubleshoot your tests using Automation results.
Overview
The run page makes it easy to quickly review and take action on failures. You can see key details for quick failure assessment while still allowing you to dig deeper when needed with things like comparison match and provided logs. The page also shows self-healed blocks directly on the run page allowing you to make a more informed decision about whether it’s necessary to jump to the video and full step list in the editor.
Reviewing a Failed Step
From the run page, click on a failed test's row to view details on why the test failed. Expanding the failure shows a detailed view with the following information:
- Screen during failure: the screen searched during the failing step
- Compare match: compare the target element to the closest match found
- To accept the closest match found, click Set as target... and crop and review to save the changes to the step.
To take a closer look, click Open to view the test result in more detail or make additional changes outside of the failed step.
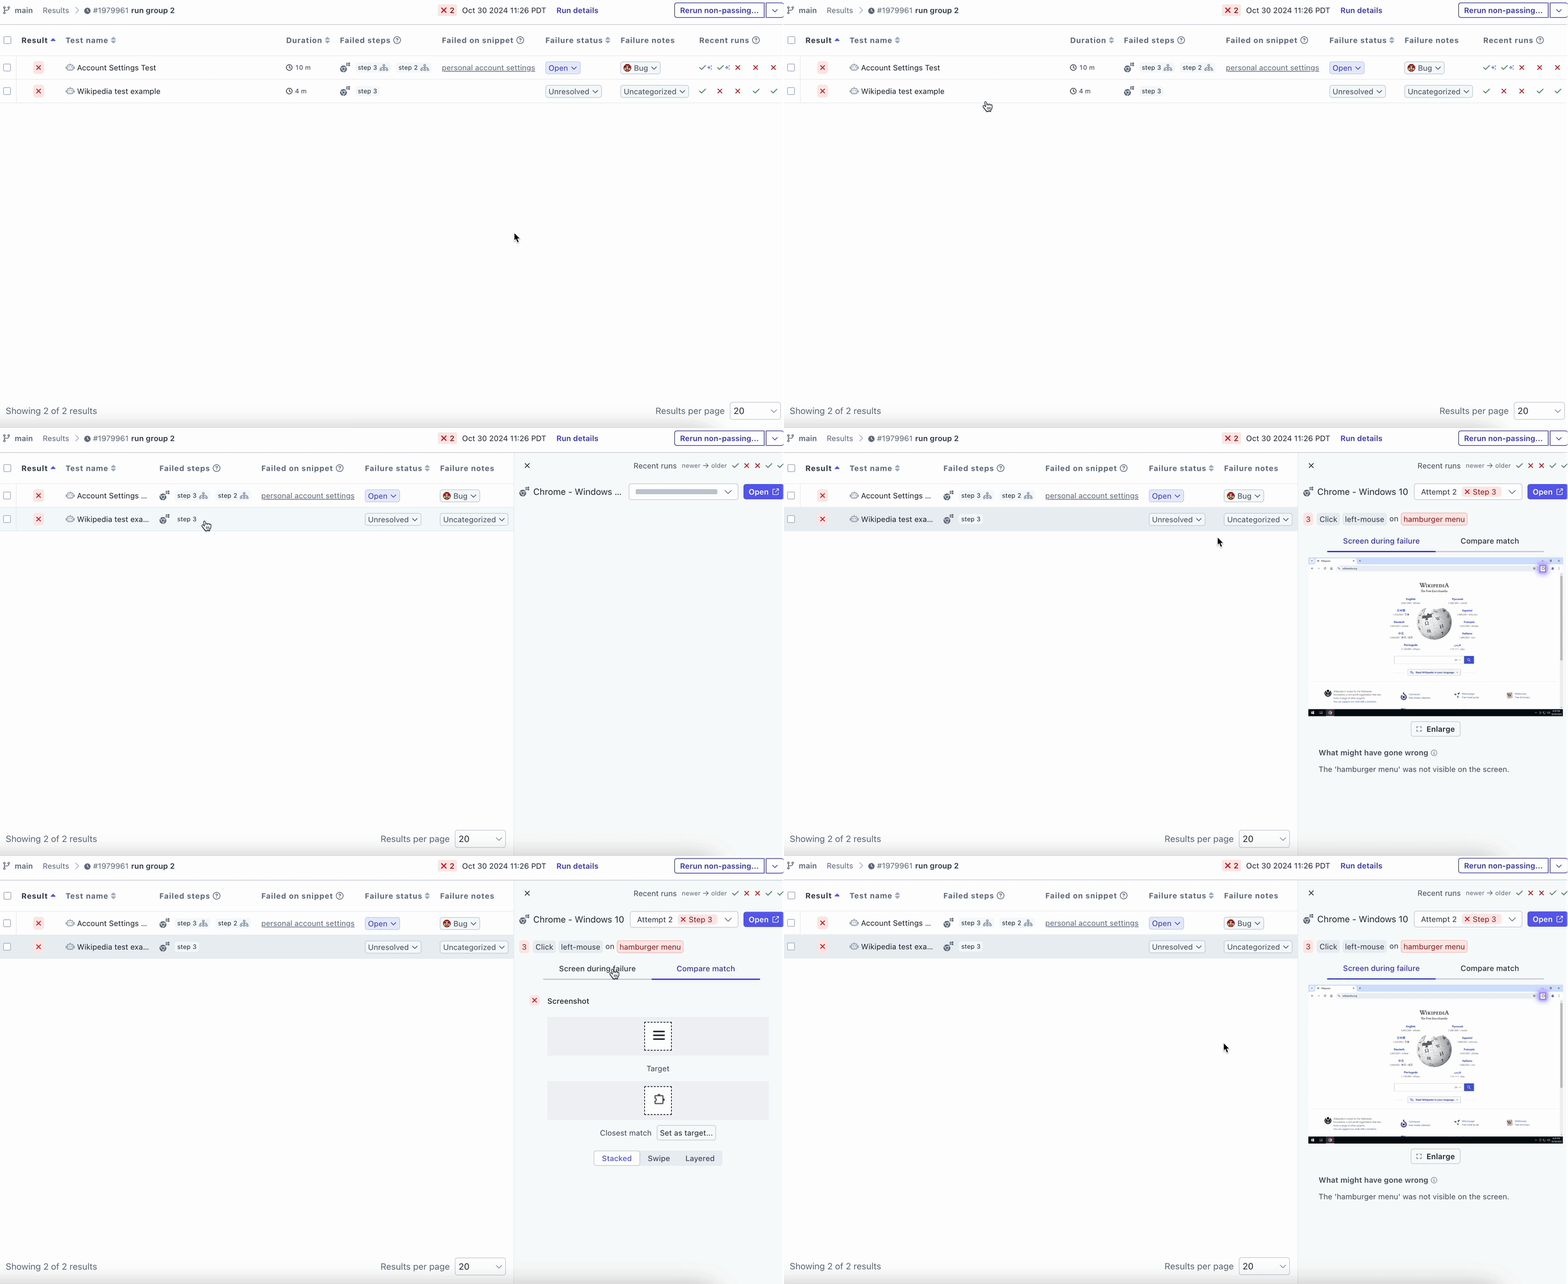
Image Comparison and Update
For failed steps, you can investigate further by comparing the target and closest-matched images.
- Click Compare match on the expanded test failure.
- Use the Swipe or Layered options to determine whether the closest match can be used.
- When you determine what changes must be made, make the appropriate changes to the test.
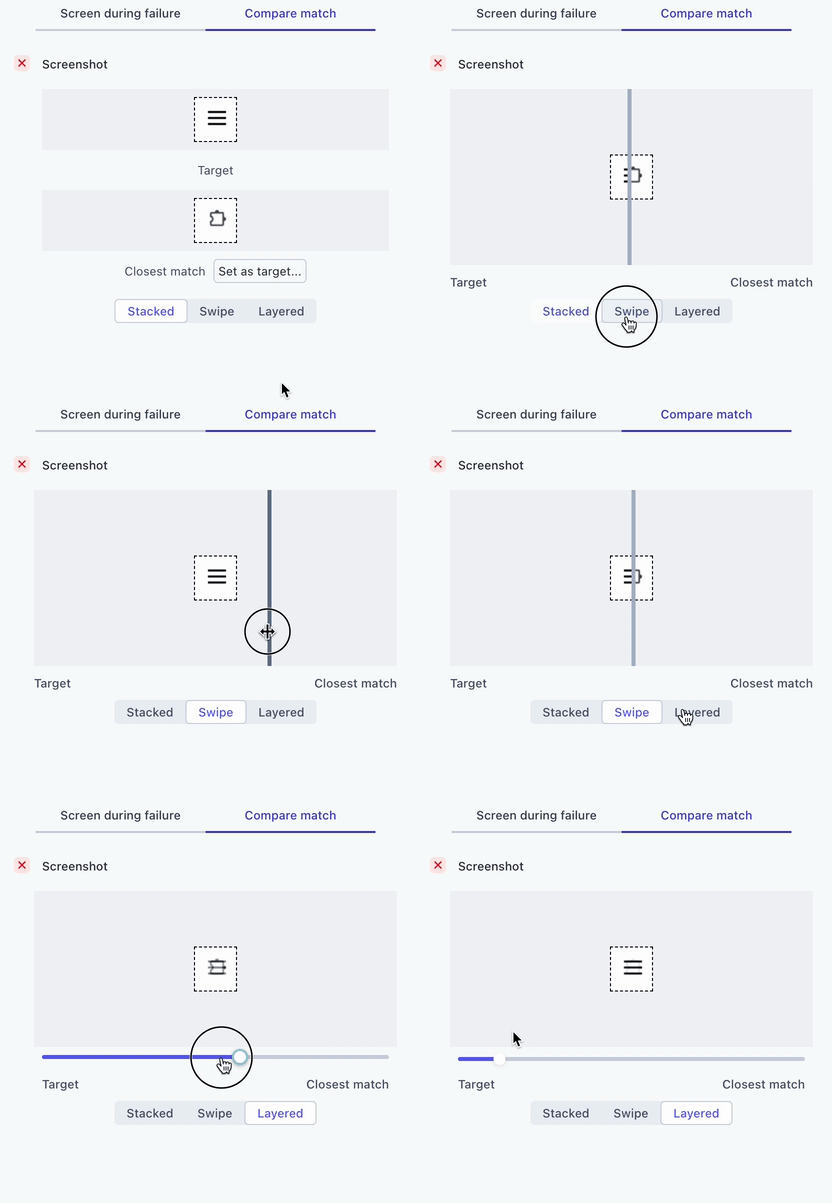
Comparing image differences.
Test Run Times
By clicking 'Timeline' you will be able to see the stages of each test within your run. Your run will only complete as quickly as the slowest test, this view is helpful to identify which individual tests were delayed because of concurrency limits, test data, or because they were too long.
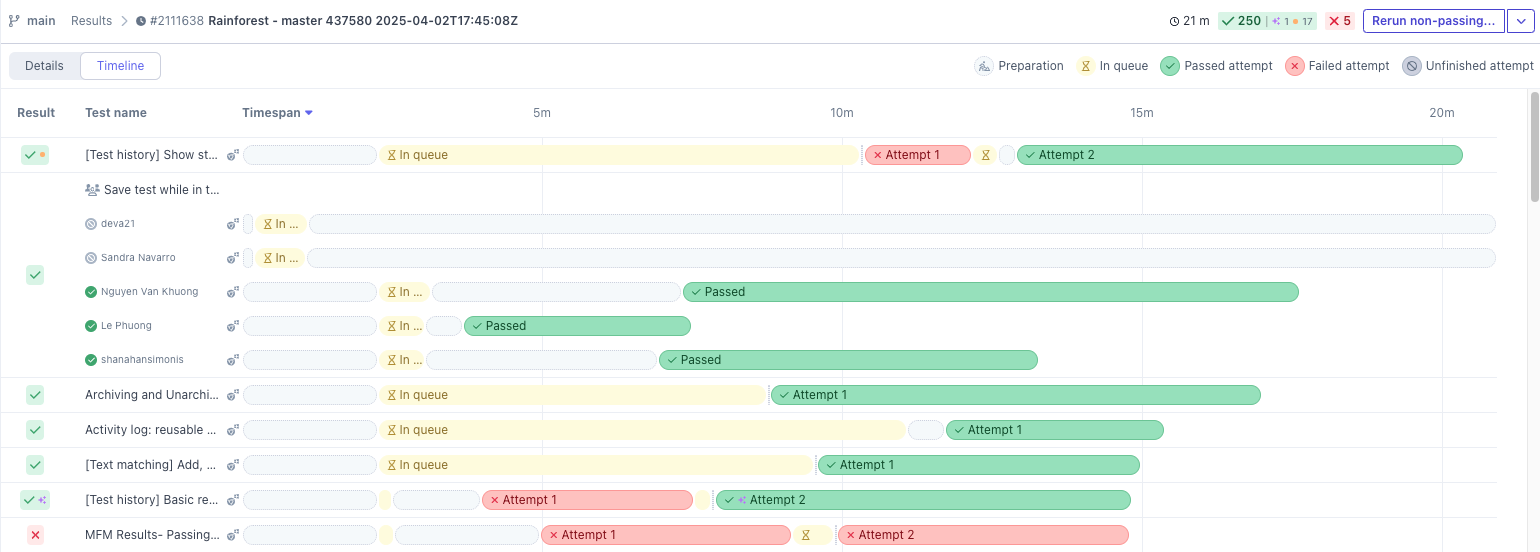
Timeline View
States
-
Preparation: This includes two main steps. 1. Work done on the Rainforest side to set up the run. this is usually done in a few seconds. 2. Time needed to call a webhook that’s set up on your environment and receive a response. If the time needed to get a response back from your webhook takes a significant portion of your run time, we recommend you look at options to optimize performance.
-
In queue: Any of the following causes can leave your test “in queue” but fortunately each can be fixed:
- Concurrency limit: The Concurrency Limit on the Global Settings page allows you to control this number, which helps prevent server overloads. Upping your capacity and raising your concurrency limit will speed up future runs.
- Reusable test data: Marking dynamic data as reusable can significantly impact your test result time. Reusing data creates a gate system of “One out, one in” for your dynamic data. Adding more data to the CSV of test data will speed up any tests that were effectively rate limited by the lack of sufficient data.
- Obscure VM types: Most of the time Rainforest has plenty of VMs standing by, but if many runs are kicked off on less common platforms (platforms other than Chrome, Firefox, Safari, Edge) at the same time, it can leave some tests in the queue for a few minutes.
-
Execution: This is the time actually taken for automation or the testers to evaluate your test. To improve speed, cut back on the length of your tests. We recommend keeping automated tests under 100 steps and tester community tests under 20 steps.
FAQ
-
Why were my tests in queue for so long?
99% of the time the answer is concurrency limits or reusable test data without sufficient test data for all the tests being run. Check out those pages in settings first. Concurrency limits impact all tests, and reusable test data will just impact any tests with those data included.
-
Why can’t I see in progress runs?
Unfortunately we don’t show this visualization until all jobs are complete so we can calculate the time spent in different states correctly. If you have an in progress run that’s taking an unexpectedly long time, please reach out to support.
Test Retries
Sometimes, tests fail due to reasons including network, load, and intermittent bug issues. The Test Retries feature allows you to automatically rerun failed automation tests up to 3 additional times to attempt to pass the test. For more information on this feature, see Test Retries
The Site Can’t Be Reached When Navigating to the Test URL
If you find the Rainforest virtual machine can't reach your website, make sure to whitelist all Rainforest IP addresses. See Which IP Addresses Do Rainforest Tests Come From? for more information.
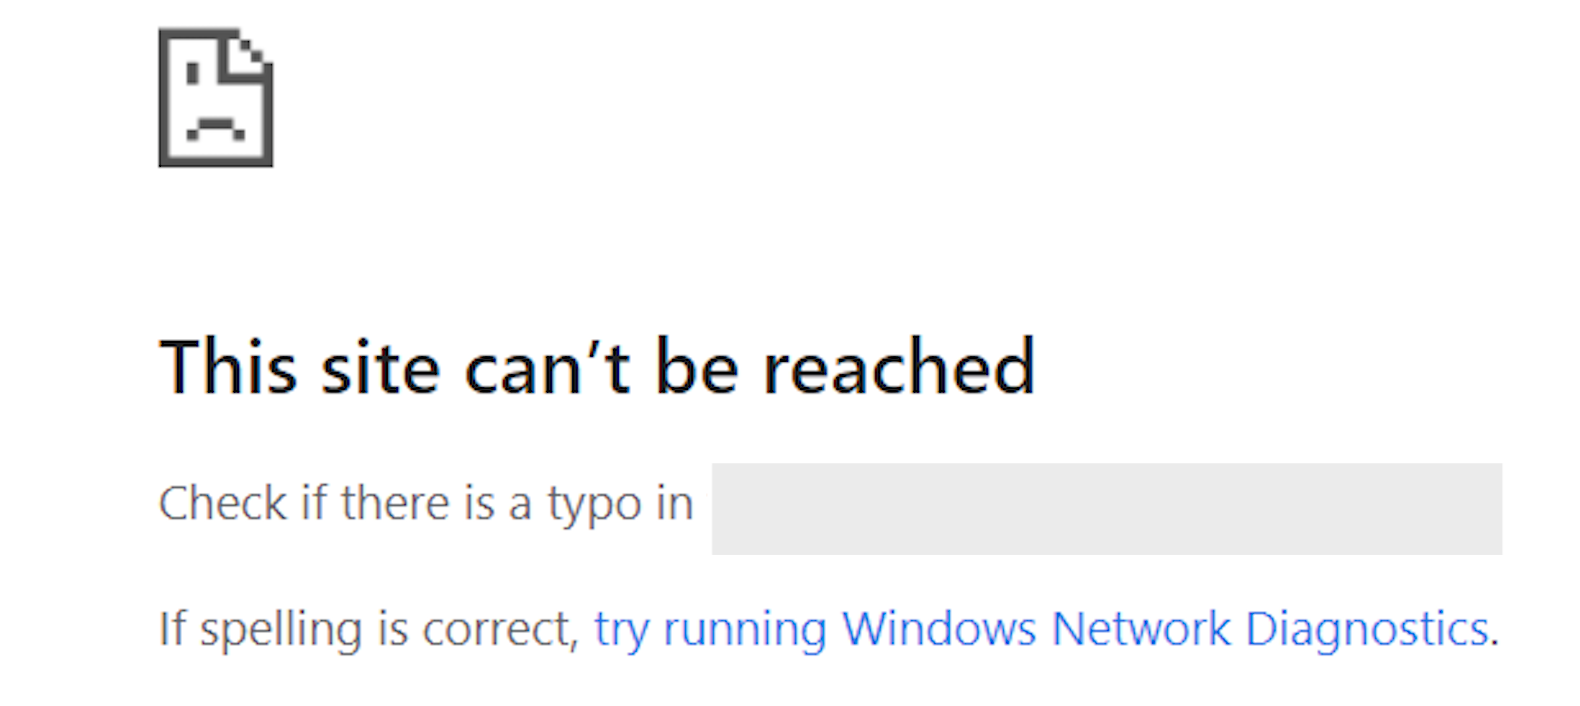
Example of a blocked IP address.
Troubleshooting with HTTP, Browser, and Video Logs
With HTTP logs, you can view all HTTP traffic that passed to and from each Rainforest virtual machine (VM) during a test. Use the logs to examine request interruptions at the network level and see the order in which HTTP requests were made.
To view a test’s HTTP logs, browser logs, or a recording of the video results:
- Click the Open button on the test's row on the run page
- Click the 3-dot icon at the top right of the page.
- Select “HTTP Logs,” “Browser Logs,” or “Video” to download the relevant file.
View the HAR and browser files in your text editor of choice, using this recommended tool or Google Chrome extension.
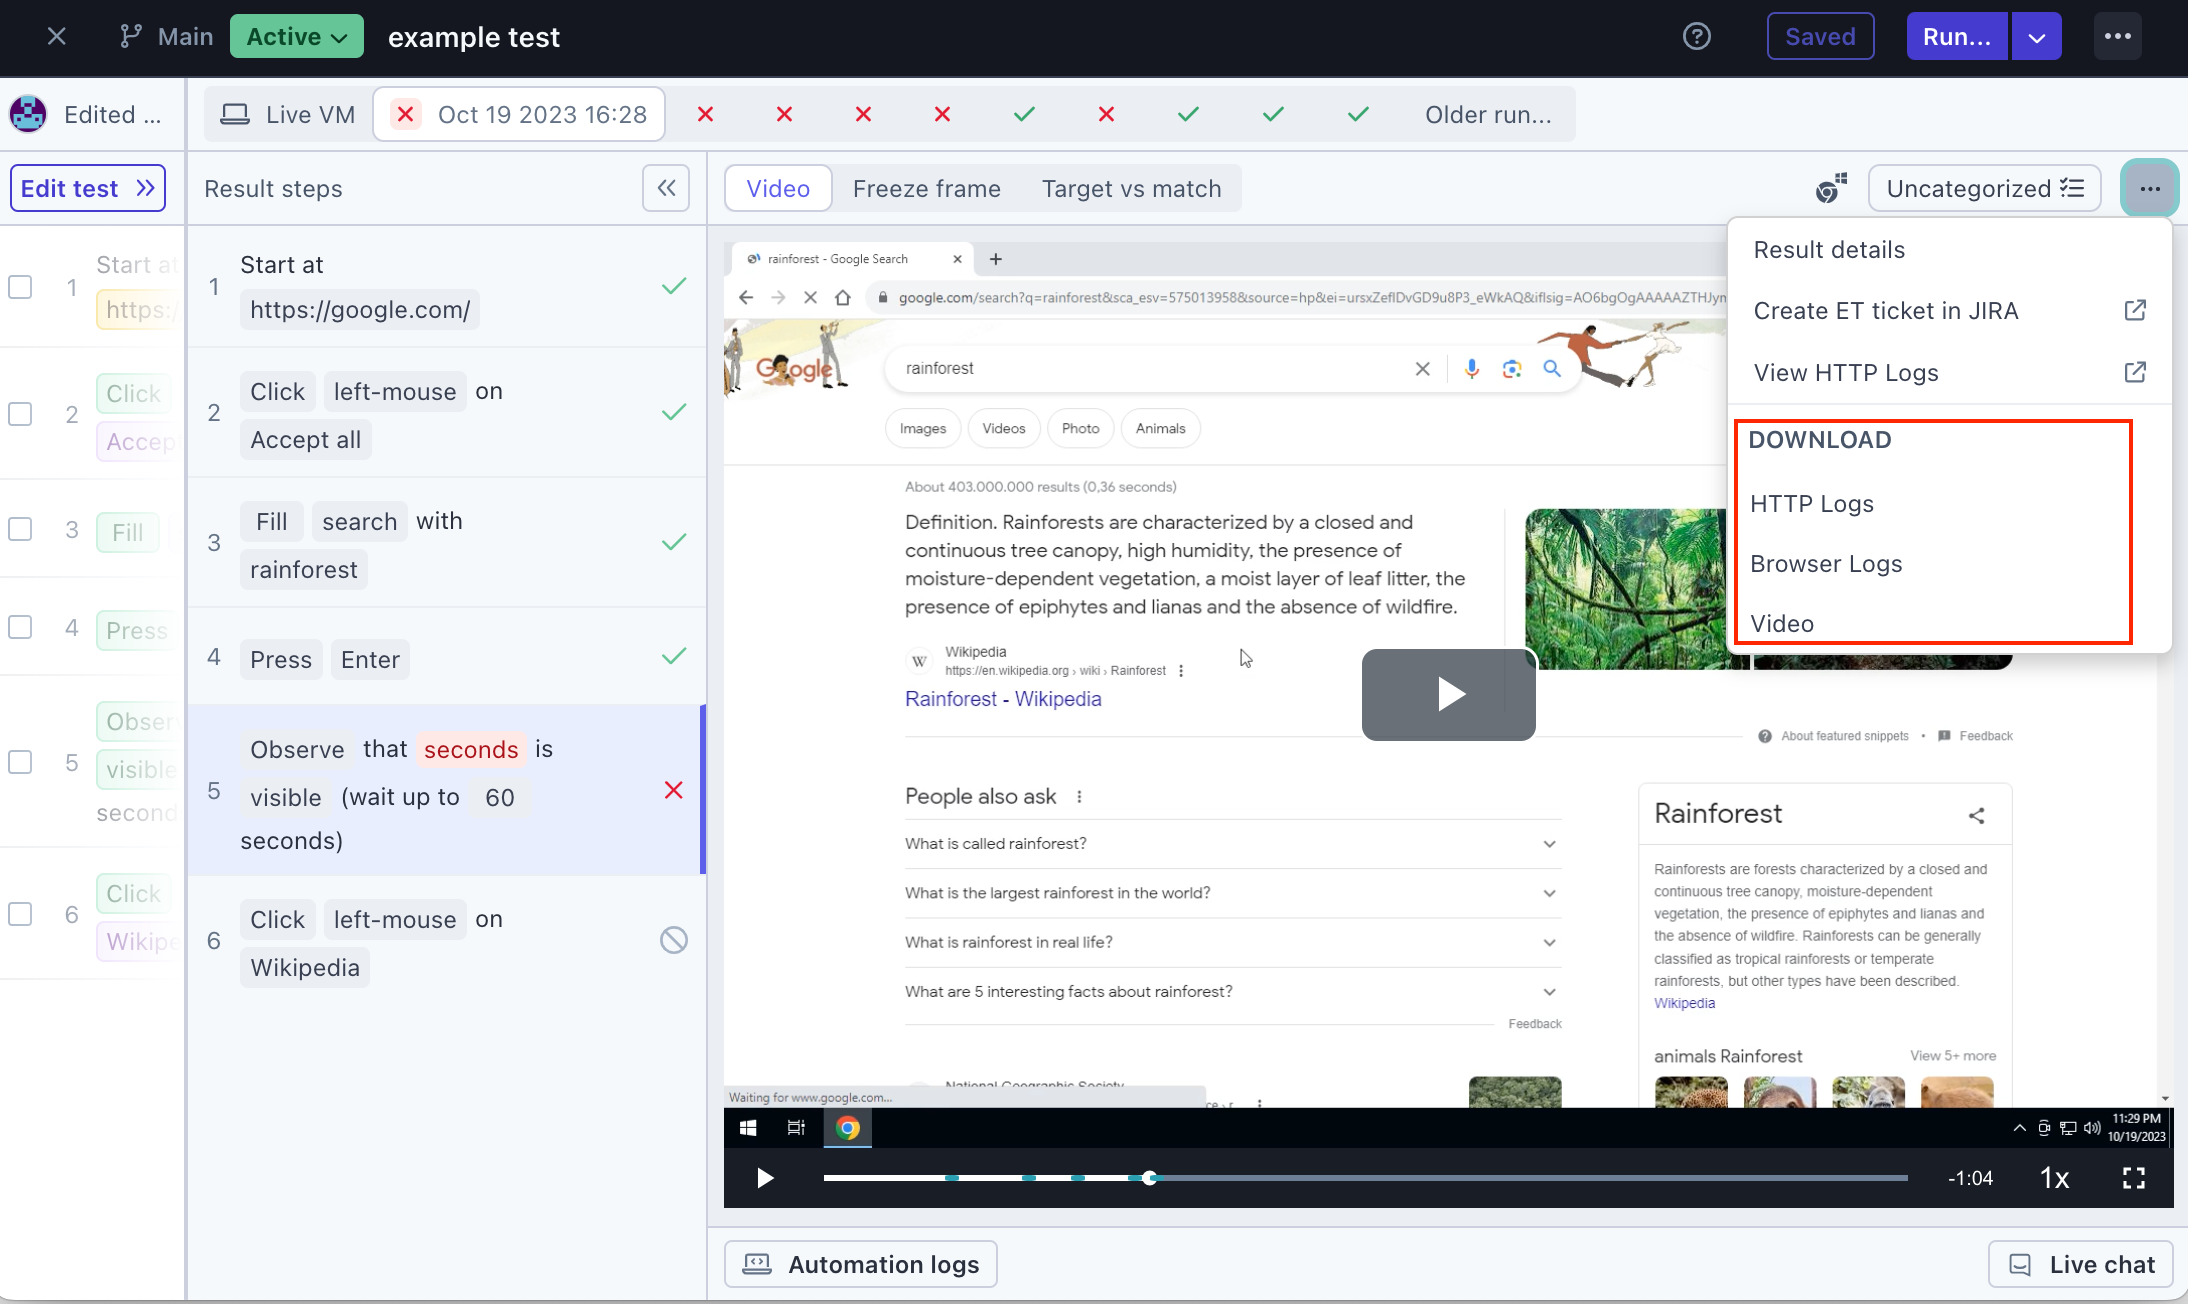
Getting HTTP logs for troubleshooting.
If you have any questions, reach out to us at [email protected].
Updated 2 months ago
